Imagine you go to the store with $10, hoping to buy your favorite snacks. But over time, prices keep going up. That’s inflation. It means your $10 doesn’t buy as much as it used to. Why does this happen? Well, it’s like a cycle. When more money flows into the economy, people start wanting to buy more goods. Because of this, it becomes more expensive to make things. This leads to everything becoming more expensive.
Understanding Inflation: The way we monitor inflation is by the Consumer Price Index (CPI), which tracks how prices change over time. When inflation happens, it affects everyone. For example, think about buying a house. If prices are going up fast, it’s harder to afford one, and even if you manage to buy, you might end up paying more for a mortgage. So, inflation makes it tougher for people to buy things they need, like homes. Additionally, inflation can erode the value of savings over time. Suppose you’ve been diligently saving for retirement, but the purchasing power of your savings diminishes due to inflation. It means you may not be able to afford as much in the future with the same amount of money saved today. Thus, inflation isn’t just about rising prices; it also impacts the financial security and plans of individuals and families.
Measuring Inflation: Think of inflation as checking the pulse of prices. To do this, we pick out a bunch of things people buy all the time, like food, housing, transportation, and more. We call this mix a “basket of goods.” Then, we keep an eye on how much it costs to buy this basket over time. If the total cost keeps going up, that tells us inflation is happening. So, by watching this basket each month, we can see how price changes affect how much it costs for people to live their lives. Below is a graph of how the inflation rates have changed over the past 20 years.

“Charts Related to the Latest ‘Consumer Price Index’ News Release | More Chart Packages.” U.S. Bureau of Labor Statistics, U.S. Bureau of Labor Statistics, www.bls.gov/charts/consumer-price-index/consumer-price-index-by-category-line-chart.htm. Accessed 8 Apr. 2024.
The Impact on Your Investments: From 1928 to 2023, if you invested in the S&P 500, your money would have grown by around 9.90% every year on average. During the same time, prices kept going up on average by about 3.07% each year due to inflation. But here’s the cool part: Even though prices were rising, your investment grew much faster, beating inflation by a whopping 6.83%. Historically, investments in the stock market have been an excellent hedge against inflation.
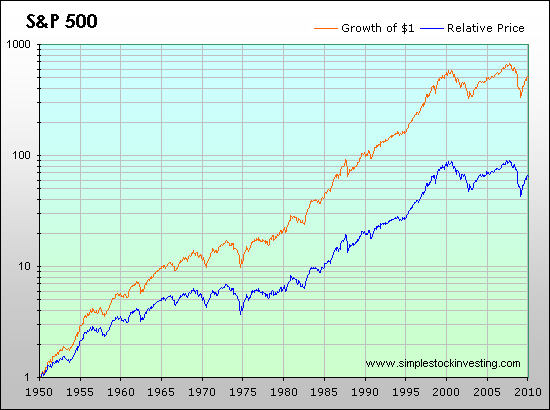
“S&P 500: Total and Inflation-Adjusted Historical Returns.” Http://Www.Simplestockinvesting.Com/, www.simplestockinvesting.com/SP500-historical-real-total-returns.htm. Accessed 8 Apr. 2024.
When collaborating with Wisely Advised, we understand the impact of inflation on your portfolio. Our team carefully considers its effects and offers valuable insight to navigate these inflationary changes with confidence. By staying proactive and adaptive, we ensure your investments remain resilient in the face of evolving economic landscapes.